Based on a report published by the OSPAR Commission, the largest sources of microplastic in the North-East Atlantic are tyre wear and litter (such as bottles, packaging and other mismanaged plastic) with estimated amounts of around 100,000 tons per year (1, 2). Plastic arrives in our oceans in multiple ways, for example: litter is washed into the sea by rivers and drains, or left at the beach, or blown from badly managed bins and landfill sites (3).
Since 2017, the marine laboratory at Thomson Environmental Consultants has been actively involved in the research on microplastic present in the seafloor. This might seem surprising, as we are a team of experts specialised in assessing the diversity and abundance of animals in marine samples.
However, in order to better understand the impact of microplastic on marine life, government agencies ask us to evaluate also the amount of microplastic alongside the animals in their samples. Prior to 2017, the only recording policy available was the Marine Litter Guidance for European Seas, which was established for larger plastic items and other litter found in trawls, used for catching fish and shrimps, for example (4).
But for assessing the biodiversity of the seafloor, the preferred sampling gear is traditionally a grab, which collects part of the seafloor, including all living organisms (and litter) present within or on top. Due to the action of currents and waves, litter found in benthic samples is usually heavily fragmented and is rather small, hence the categories from the Marine Litter Guidance are rarely applicable. This is why our lead scientist Dr Ruth Barnich established a policy for the visual assessment of plastic and microplastic litter from benthic samples, which was presented at the World Conference for Marine Biodiversity in 2018 and shared with the government agencies and other laboratories in the UK.
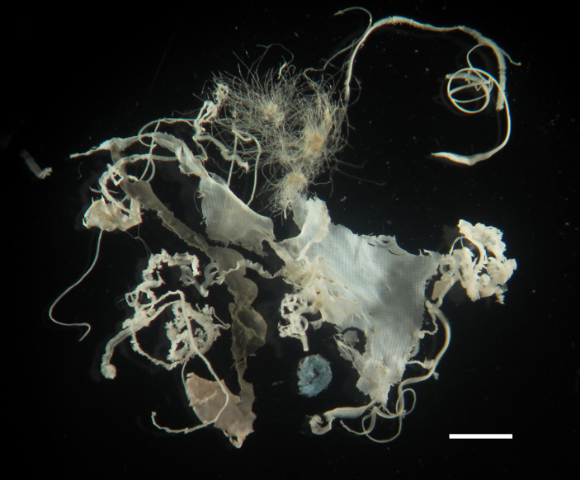
Figure 1. Plastic fragments extracted from a seafloor sample (scale 3 mm)
While we are now able to classify and quantify our microplastic particles consistently, also across different laboratories, it is still rather difficult to trace back the origin of the microplastic based on a visual assessment alone. Further investigations such as spectroscopical analysis would require involving specialised laboratories at added cost.
One category of plastic litter is, however, rather easy to recognise, these are fragments of sanitary items, such as sanitary pads and face masks ! Pads and masks are usually built of several layers, including plastic sheets and fibrous material. The origin of fibres in our samples is nearly impossible to tell, but plastic sheets from pads and face masks present usually a characteristic imprinted pattern, which is visible even on small fragments measuring only few mm in diameter. Following a conversation with one of our governmental clients back in 2021, we conducted a small study and looked at the composition of various sanitary items to get a better understanding of the types of patterns that we could possibly find and identify in our samples.
We looked at the patterns of plastic sheets from a variety of sanitary pads and nappies. While disposable nappies are made up of different layers of fibrous material (plastic or other) and usually have no plastic sheet, most pads do. We investigated pads of different thickness and found quite often the same type of sheet, also across different brands. Here are two examples of common print patterns:
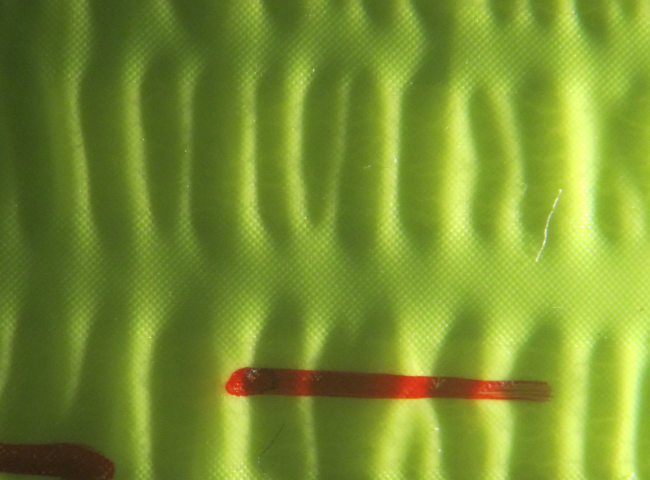
Figure 2. Smooth sheet with print pattern from sanitary pad (scale 10 mm)
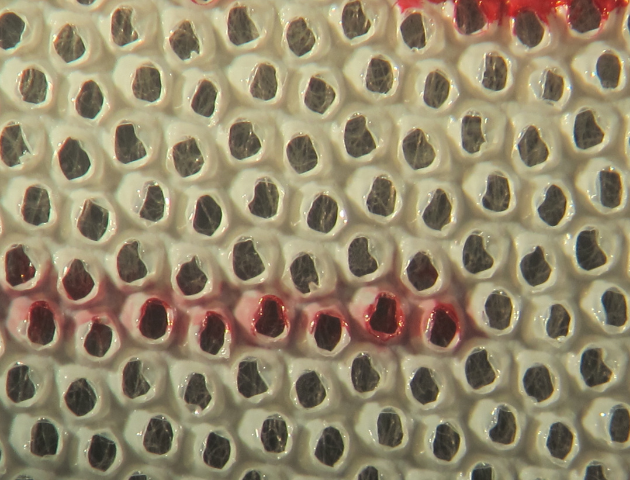
Figure 3. Perforated sheet from sanitary pad (scale 10 mm)
Fragments from the most common type of disposable face masks, that were and are still in use against coronavirus, are easily recognisable. They have a plastic sheet with large, rather characteristic, embossed squares that most of us should be very familiar with. So far, we did not find any of these particles in our samples, but we are expecting to find them in the years to come.
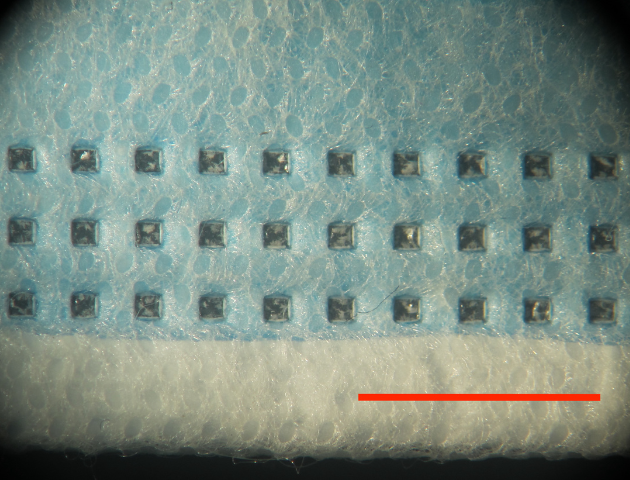
Figure 4. Detail of face mask with characteristic squares (scale 10 mm)
Why is it relevant to know how many plastic particles originate from sanitary items? Because their presence and the quantities found can help address issues around illegal discharge of waste (from ships, for example) or untreated sewage released in our rivers and coastal waters. Currently water companies are only allowed to discharge untreated sewage in exceptional circumstances, such as heavy rain or storm (5, 6). An investigation by the BBC’s Panorama programme in 2021 found that, on top of that, many companies in England and Wales are also dumping illegally billions of litres of untreated sewage into our rivers, which ultimately ends up in our oceans (7).
More details on these topics can be found below.
Author: Dr Ruth Barnich
References
1. Verschoor et al. (2017). Report and assessment of land-based inputs of microplastics in the marine environment. OSPAR Commission 2017. Publication 705, 1-94.
2. https://www.ospar.org/convention/the-north-east-atlantic
3. https://www.sas.org.uk/our-work/plastic-pollution/plastic-pollution-facts-figures/
4. MSFD Technical Subgroup on Marine Litter (2013). Guidance on Monitoring of Marine Litter in European Seas, a guidance document within the Common Implementation Strategy for the Marine Strategy Framework Directive. Joint Research Centre Scientific and Policy Reports 2013, 1-128.
5. https://environment.data.gov.uk/dataset/21e15f12-0df8-4bfc-b763-45226c16a8ac
6. https://theriverstrust.org/key-issues/sewage-in-rivers
7. https://www.bbc.co.uk/news/uk-56721660
Photographic credits
Figures 1-4 all by Ruth Barnich, Thomson Environmental Consultants