Visual data communication is living in a golden age. Much of the media relies on visual tools to address their audience, particularly about science and technology. But when we see a beautiful painting of a fish or a bird on a web page, in a gallery, or even in a museum, is that a scientific illustration? Sometimes it is, but scientific illustration is much more than just pleasing to look at.
What makes an illustration scientific?
The main goal of a scientific illustration is to explain something graphically through a drawing, infographic, or painting, to give relevant scientific information to the viewer. The scientific illustrator can schematize, highlight what is important, or explain a process. An illustration offers more options than a plain photograph for conveying information.
Scientific illustration could be mistaken for natural art or even hyper-realism but it is not the same. In this discipline, there is no room for subjectivity, as it has to serve the purpose of science communication and hence the most important features are accuracy and objectivity. The illustration must be an accurate representation of the matter, which can be a wide range of subjects, from animals and plants to substances, processes or even phenomena. Different subjects require different techniques and tools; any artistic technique can be used in scientific illustration, such as pencil, watercolours, or ink. Digital software has recently transformed scientific illustration and communication, adding new levels of representation, special effects and shortening processing time.
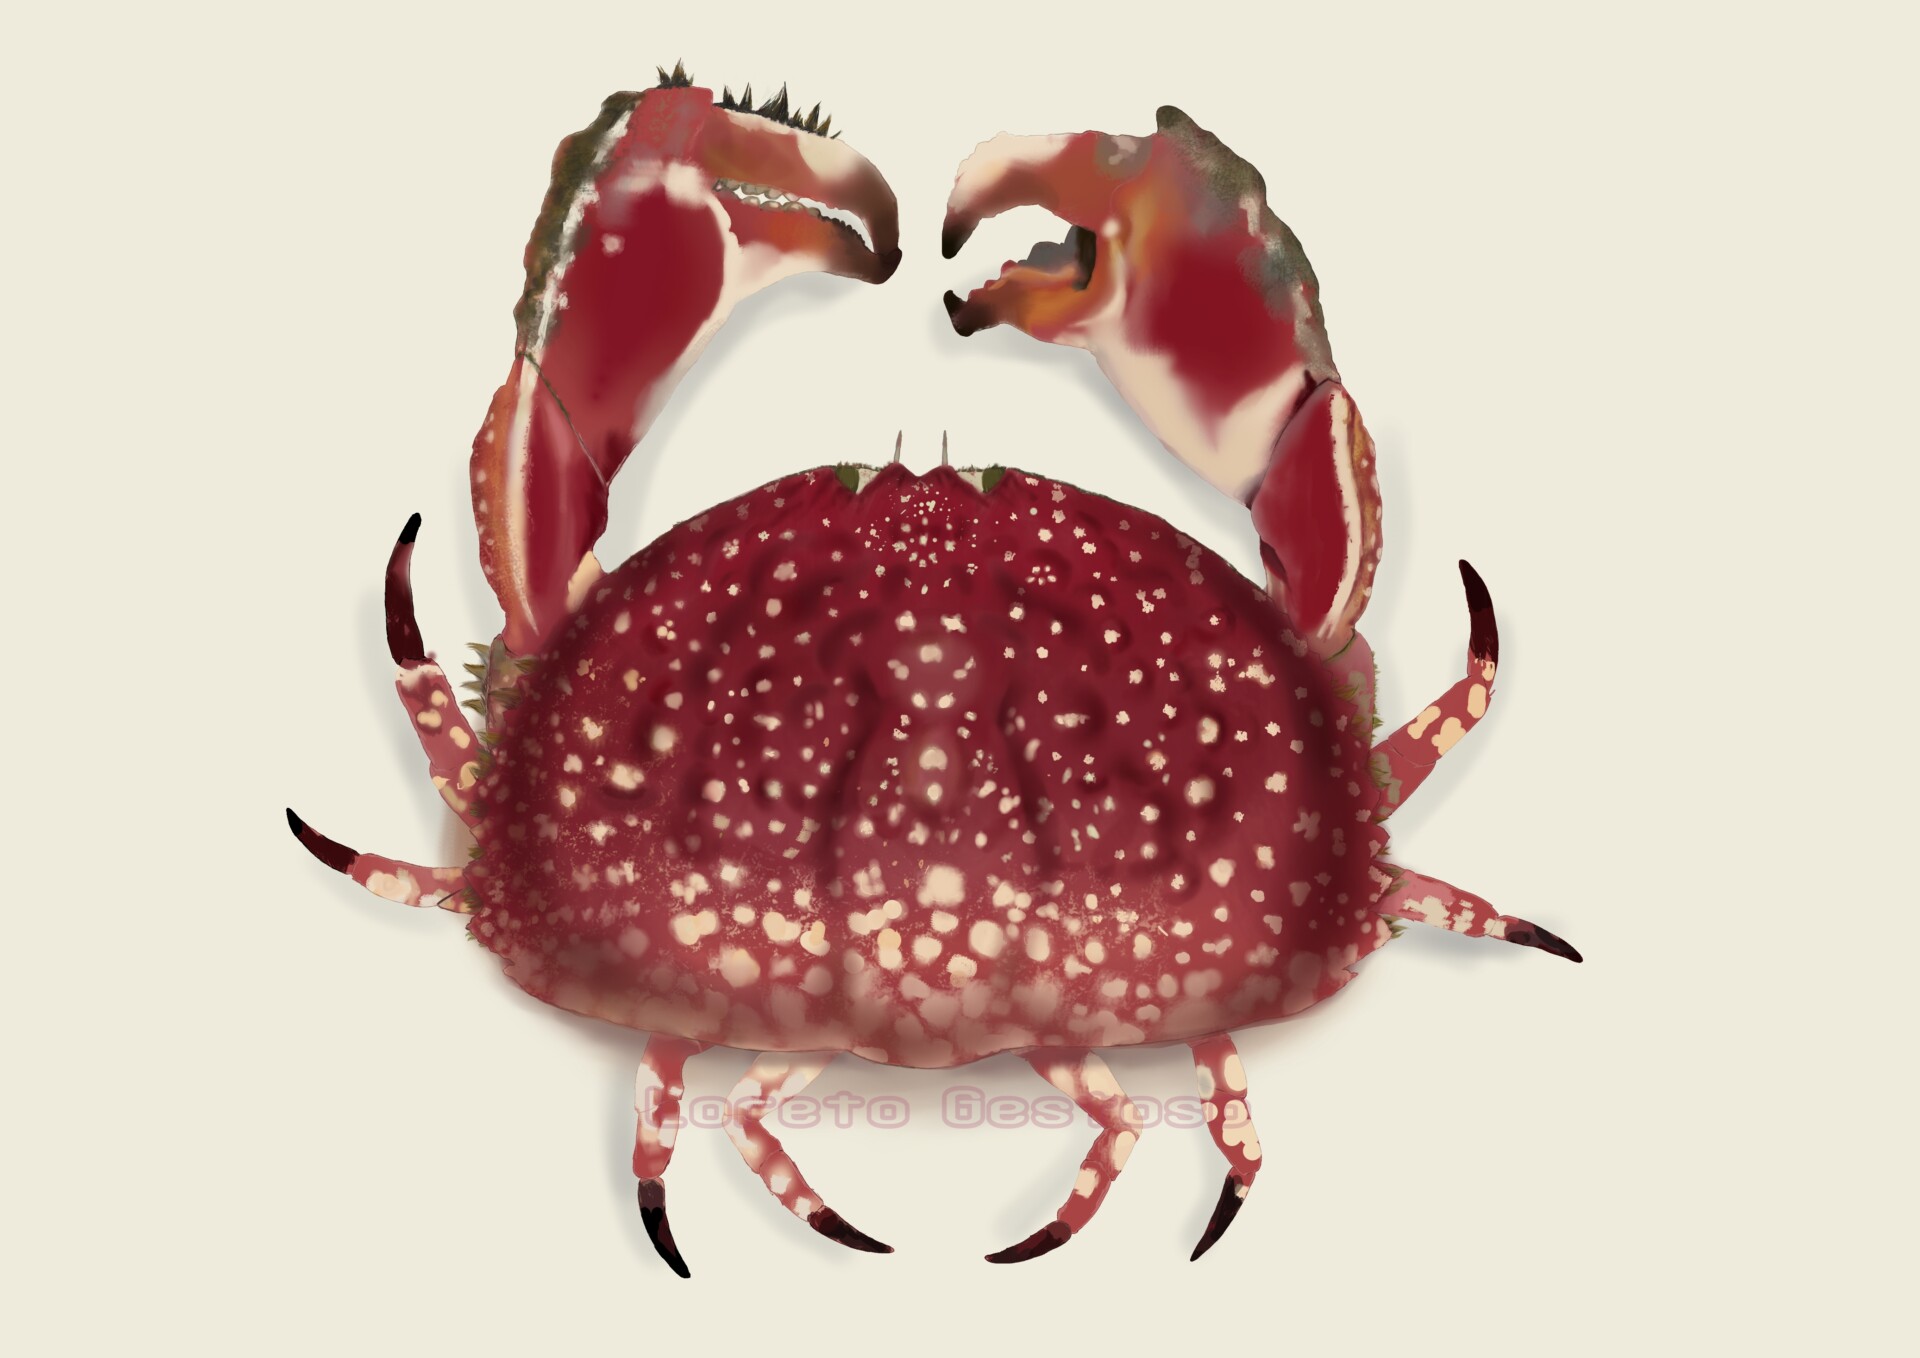
Figure 1. Calappa convexa de Saussure, 1853, drawing by Loreto Gestoso.
The selection of techniques is very important for the illustration outcome. Hyper-realism for animal representation is common in zoology as well as schematic representations and diorama. Drawings are sometimes the only way to show the important characters of some species, for instance in the case of extinct animals or plants where only incomplete specimens have been found. In palaeontology, reconstructions based on scientific illustrations of extinct species are very common, and nowadays with new technologies like 3D modelling the results are more realistic and spectacular (1). In geology, an unconformity can be represented by an element called “cut out” where the illustrator “cuts” a piece of the topography to show the layers under the surface. In physics and chemistry, the use of diagrams, schemes and abstract representations of phenomena that cannot be seen by the human eye are very common. We can find examples of these different techniques in museum displays, schoolbooks, and scientific publications.
A scientific illustration must be both precise and visually appealing to get the viewers’ attention, but it is not always fidelity that matters. Sometimes it is more important to show how a damaged part in the original object would look like in its natural state. In other instances, the illustrator might choose simplicity, in order to reduce “noise” or when communicating science to the general public or a young audience.
In 2020, the world was shocked with the surge of the COVID-19 pandemic. Representations of virus SARS-CoV-2 were shown in specialized and general media countless times, through drawings, 3D images or animated models, but the virus was not always accurately represented. This is where the difference between a scientific illustrator and an illustrator or graphic designer lies. Scientific illustrators have usually had scientific and artistic training. Some combine the two careers, drawing illustrations for their own scientific articles, posters, and presentations.
Whatever the training of the illustrator, being well informed is crucial. Topic research and documentation is the most critical stage of any scientific illustration project, and all professionals agree that it takes most of the project time. No illustrator can be an expert in every topic, so the compilation of information about the subject must be thorough and extensive. Nowadays, one important tool for documentation is obviously the internet. While in former times, access to a vast and complete library was vital, nowadays we can access a wide variety of digitalized documentation through search engines, online scientific magazines, web pages of scientific societies, specialized scientific media portals and much more. However, with so much information at hand there is a high risk of finding incorrect or inaccurate information. Therefore, contact with an expert is essential as all sources of information must be checked to confirm they are legitimate and accurate. Renowned artist Fernando Baptista, senior editor at the National Geographic Magazine, has an extensive career in scientific illustration and infographic creation. In his interview for the “Hablemos de infografia” podcast (“Let’s talk about infographics”) he gives an insight into the importance of the documentation step and how during National Geographic projects his team always seek scientific advice, with up to 20 specialists working on each project. He also talks about the amount of time spent by experts in these projects; sometimes more than 500 hours are spent on a single project from start to finish.
The history of scientific illustration
The origins of scientific illustration can be traced far back through history. During the pharaonic period in Egypt, paintings were not only important as religious and political propaganda, but also as a way to educate people in fields as diverse as social behaviour, accounting, and resource management. In ancient Rome, Pliny the elder (AD 23–79) was a pioneer in drawing the natural world and its creatures, although his drawings were not generally very accurate or realistic. We see more accurate scientific illustrations emerging from the seventeenth century, when the first anatomical studies took place. Scientists rushed to draw the first images of the internal structure of the human body, which helped to communicate new discoveries to students and researchers.
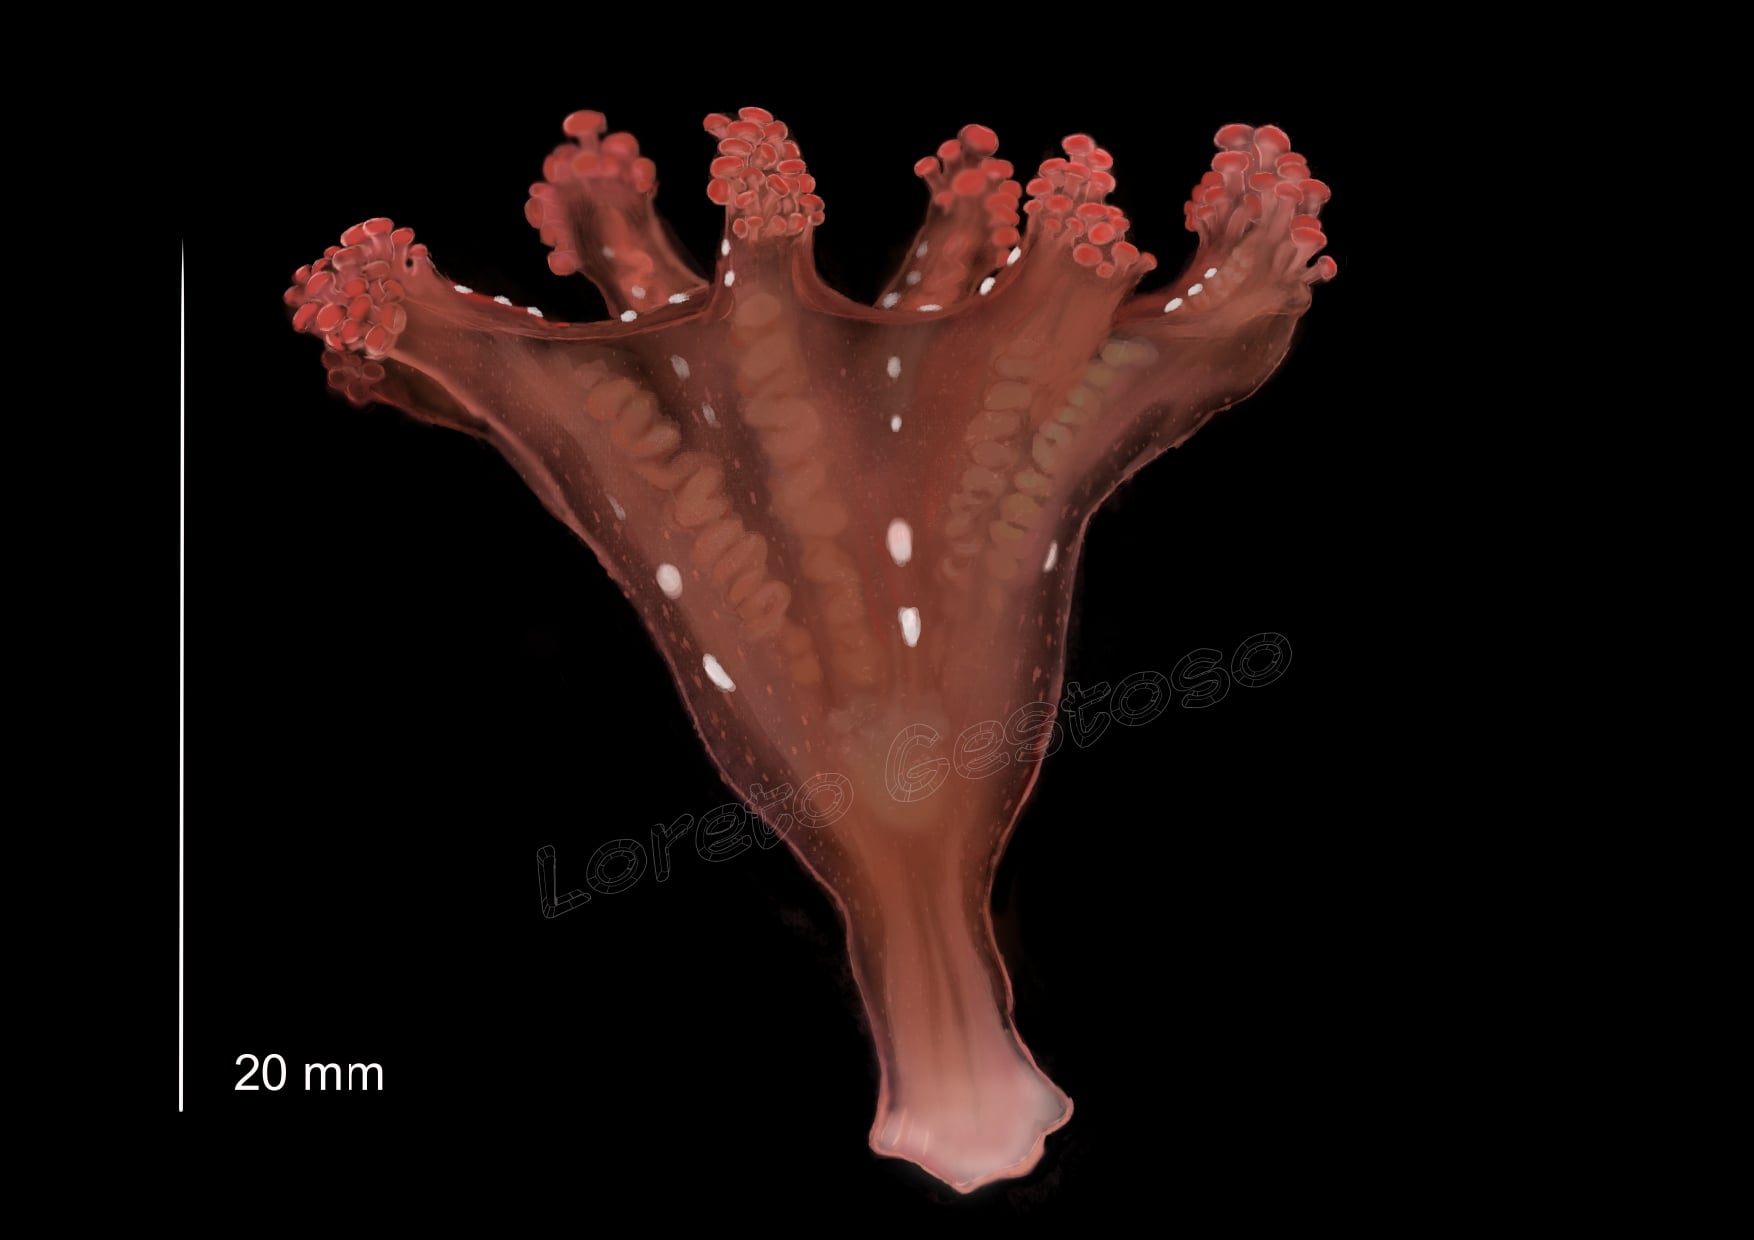
Figure 2. Calvadosia campanulata (Lamouroux, 1815), drawing by Loreto Gestoso.
The 17th and 18th centuries were marked by great explorations, with many of these expeditions accompanied by artists to document the strange shapes of the exotic flora and fauna encountered on their way, and to share these discoveries with society on their return. One of the most famous naturalists and explorers, Alexander von Humboldt (1769-1859), amazed the scientific world with his observations on biogeography. His essays were filled with maps and illustrations such as his famous Naturgemälde; illustrations of mountains showing changes in plant distribution according to altitude, which made him a pioneer in using infographics to present this kind of data visually (2). Humboldt’s work inspired generations of naturalists and scientists including Charles Darwin, who spent five years circumnavigating the world on board HMS Beagle. With him, several artists were invited to take part in the expedition. The first official artist was August Earl, and after him others joined the Beagle’s voyage, Conrad Martens and John and Elizabeth Gould among them. They documented not only the material collected by Darwin, but also painted landscapes and watercolours about shipboard life (3). Natural and scientific illustration kept developing and became increasingly popular in the nineteenth century, when some of the most luxurious natural history books in the UK were published, mainly focussing on birds and plants. Works of most of the famous British artists at that time like Archibald Thorburn, Ellen Hawkins and Harriet Moseley are displayed in the Natural History Museum in London (4). These books were expensive and usually a treasured family heirloom.
How we use scientific illustrations today
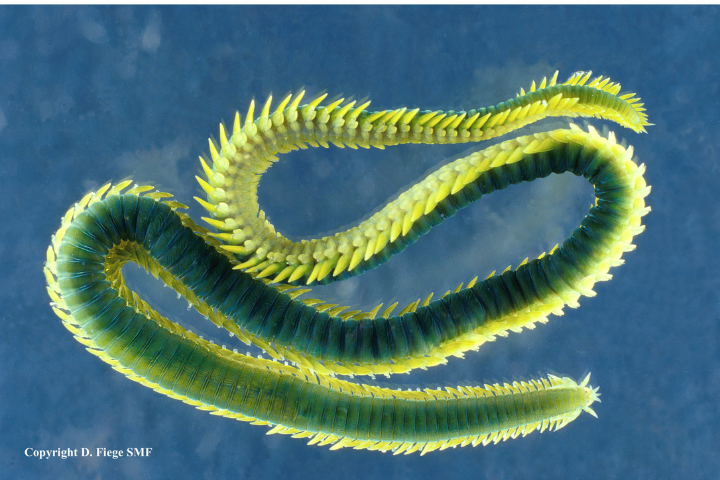
The taxonomists in Thomson’s marine team rely on accurate scientific illustration as a tool to help identify invertebrate animals for biodiversity assessments in marine habitats. Taxonomic keys, scientific articles, monographic studies, all of them include scientific illustrations to help the reader to understand and visualize the text. Even when a photograph of a specimen is available, a drawing can be more helpful, especially when the details necessary for identification are emphasized. Invertebrates from marine samples are usually small, often only several millimetres long, and their identification characters are even smaller, so the limits of photography are quickly reached. Distinguishing characters between similar species include, for example, the number of spines present in a specific region of the body, the shape of the head, or how many segments are present in the antenna. A useful scientific illustration will include and highlight all the features necessary to reach a species level identification, while in a photograph they could be difficult, or even impossible, to see.
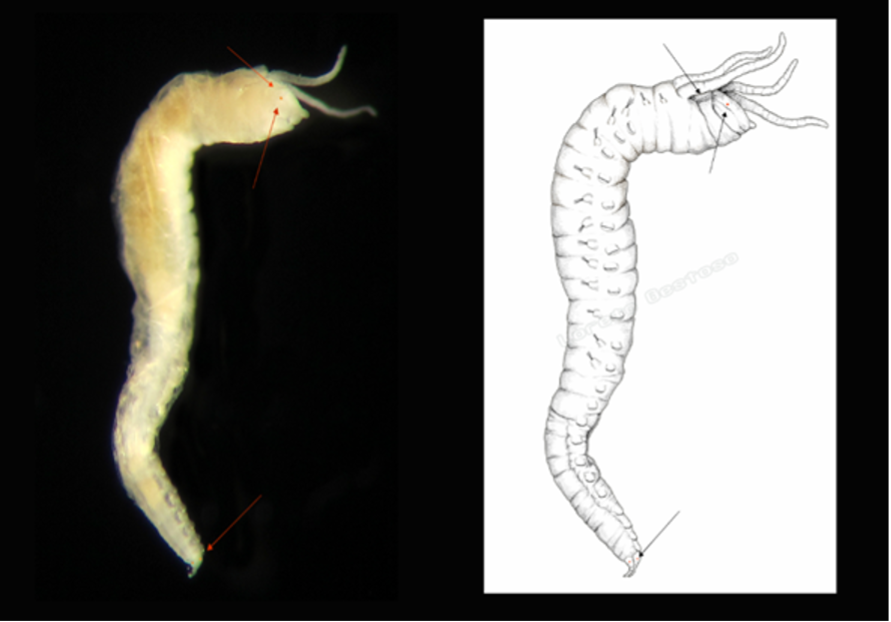
Figure 3. Ampharete oculicirrata Parapar, Moreira & Barnich, 2019, photograph (left) by Ruth Barnich and drawing (right) by Loreto Gestoso.
References:
- Wittmann, B. (2013). Outlining Species: Drawing as a Research Technique in Contemporary Biology. Science in Context,26(2), 363-391. doi:10.1017/S0269889713000094
- Wulf, A. (2015). The invention of nature: Alexander von Humboldt’s new world. Alfred A. Knopf Ed. 496 pp.
- Rice, T. (2010). Voyages of Discovery: A visual celebration of ten of the greatest natural history expeditions. Natural History Museum. London 336 pp.
- Hart, A. (2017). Images of Nature. The Art of British Natural History. Natural History Museum. London 112 pp.